Data Analysis and Visualization with Python
Learn to analyze and visualize data using Python with Pandas, NumPy, and Matplotlib. Gain practical experience in cleaning datasets, performing analysis, and communicating insights effectively.
About This Program
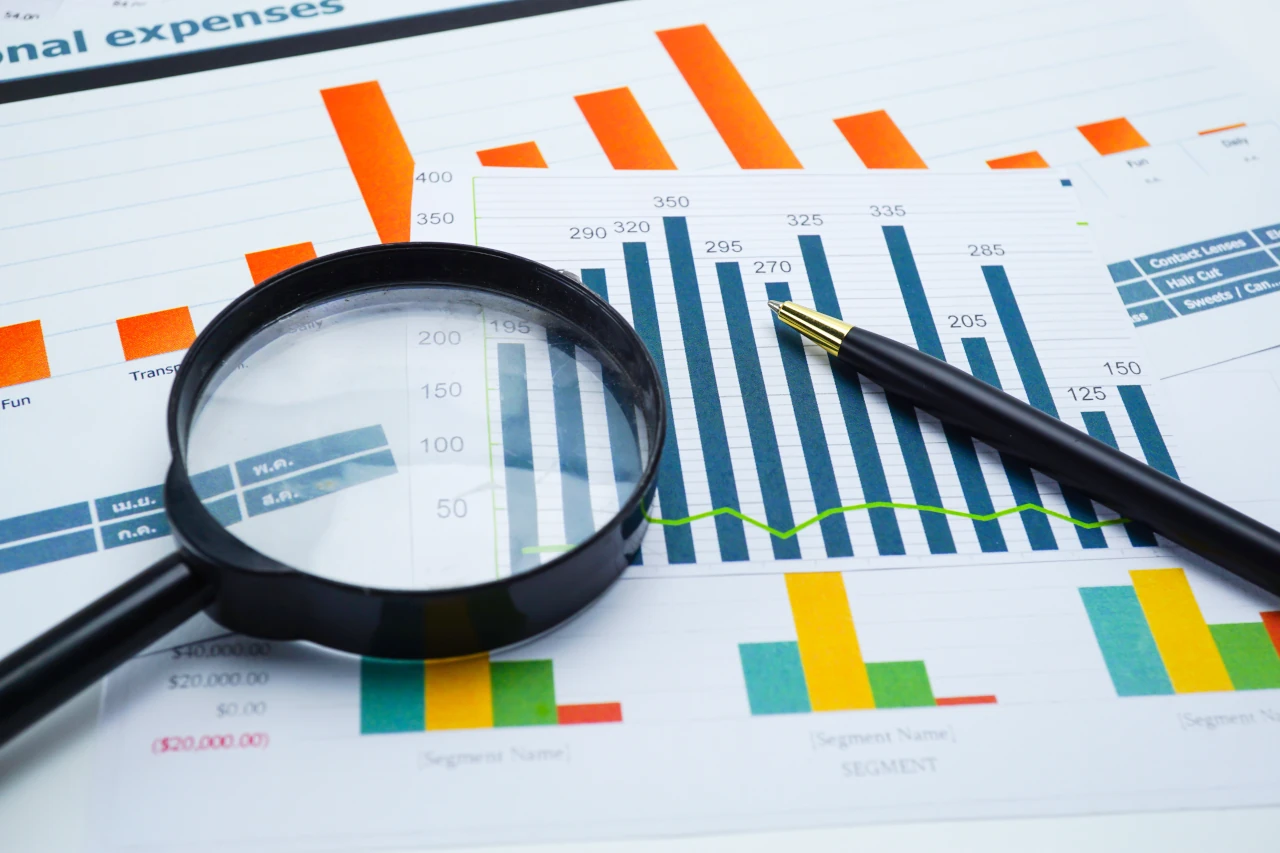
This course provides a hands-on introduction to programming and data analysis using Python. You'll start with foundational programming concepts, including data types, operators, and control structures, before progressing to practical applications in data manipulation and visualization. Using powerful libraries such as Pandas, NumPy, and Matplotlib, you'll learn how to clean, process, and analyze datasets. You'll also gain experience in visualizing data through charts, graphs, and reports, helping you communicate insights effectively. Throughout the course, you'll work with Jupyter Notebook to document your code and present findings in a structured format.
Who Should Attend
This program is designed for:
- Students
- Professionals
- Researchers
Learning Outcomes
Requirements
- Basic computer literacy
- Laptop with Python and Jupyter installed
- No prior programming experience required
Certification
ADITA Data Analysis and Visualization Certificate
Upon successful completion of the program and all required assessments
Duration
50 hours
Level
Beginner
Format
Online & In-person
Target Audience
Students, Professionals, Researchers
Certification
Yes, upon completion
Job Placement
Career support included
Related Programs
Explore these complementary programs to further enhance your AI skills